


Contagiousness increases and mortality also declines naturally
This report is originated from a public video-lesson held to the students of the University of Padua, on May 30, 2021, entitled ‘Corona virus and global warming’, uploaded to you tube and immediately censored, despite the protests (video available on request).
Then, it was followed by the drafting of this research, first presented to prof. Crisanti, on 11 November, in support of the evolutionary observations that were considered useful to provide for the public discussion, on Covid Sars-2. Subsequently presented to the DuPre Commission, (Doubt and Precaution), and described in a video conference of the commission itself, during the Conference held in Turin, at the International College of Turin, on 8 December.
It is presented for publication on ExPartibus, on December 21, in full form, with only the final addendum, concerning the new scientific data on the Omicron variant, which behaves exactly according to the evolutionary predictions presented, more contagious and much less lethal, although no features were known at the time of writing.
Andrea S. Camperio Ciani
Professore Ordinario di Etologia e Psicologia Evoluzionistica Forense
Dip. di Filosofia, Sociologia, Pedagogia e Psicologia Applicata
Edited by:
Prof. Andrea S. Camperio Ciani – University of Padova – Commission DuPre, (Dubbio e Precauzione)
Dott. Gianluca Musumeci – University Ca’ Foscari di Venezia Commission DuPre, (Dubbio e Precauzione)
1. Introduction
This report investigates the spread of the Covid-19 virus from an evolutionary perspective, according to Darwinian evolutionary theory.
Numerous evolutionary studies show the evolution of viruses concerning multicellular eukaryotic organisms. There is even a well-established hypothesis that the evolution of sexuality in multicellular organisms originated and spread to counteract virus parasitism, creating an evolutionary race between viruses, which need to parasitize multicellular hosts, and hosts that need to counteract viral contamination and infection, according to the so-called “Red Queen Hypothesis”.
For simplicity’s sake, we can consider this relationship as a relationship between prey and predators, which evolve simultaneously towards ever greater specializations: the former to invade the hosts, and the hosts to evade the viruses until a so-called dynamic equilibrium is reached, in which no one wins, and no one succumbs.
To use a significant example of a typical balanced relationship, we can consider the cheetah and Thompson’s gazelle: the cheetah, over time, has evolved ever-greater techniques and abilities to run. In this way, it can reach and prey on Thompson’s gazelles, thanks to the selective effect that, at the same time, eliminates the slower predators, unable to prey on the gazelles, and allows the evolution of faster and faster runs.
Consequently, there is a dynamic balance of a contained population of sufficiently fast cheetahs, such to prey, by chasing, only wounded, sick or old gazelles, and of gazelles which, at least the healthy and young ones, are slightly faster than the cheetahs. Therefore, neither of the two species extinguishes, and both thrive and reinvigorate progressively each other, with a dynamic trend following the well-known equations of Lotka and Volterra.
Viruses behave in the same way: they need, for their reproduction, to invade eukaryotic cells, which are the only ones that possess the necessary to allow the virus to spread and multiply, and the immune system of the hosts, which identifies the virus and destroys it before infections.
Sexuality accelerates the process of immune defence from the various viruses that evolve and try to invade them, and, on the other hand, the constant process of mutation of the viruses generates new variants to invade the hosts.
From this point of view, we can well understand, from an evolutionary point of view, how much, progressively, a dynamic balance is generated, where none of the two organisms extinguishes, and both, by force, must cohabit. The viruses, evolved in an organism, can parasitize it in part, and the host organism can defend itself unless its immune defences are insufficient or sick. The same evolutionary process takes place concerning what happens between cheetahs and gazelles: only the frailest hosts succumb, and the most recent and contagious viruses spread.
As proof of the aforementioned evolutionary process, between hosts and viruses, we see that all the viruses endemic in the man, such as herpes, papilloma, rubella, measles, and, especially, those with aerial diffusions, such as colds and flu, which need the respiration of the host, both for infecting him and for spreading, progressively create a dynamic balance, where the viruses do not have any advantage to kill him, and do so only accidentally for the too frail individuals, with a compromised immune system. The hosts also survive by infecting themselves with less lethal and more contagious viruses.
In this evolutionary perspective, which has been confirmed by evolutionary biologists in many quarters, evolutionary strategies of all viruses are:
1) the evolution towards greater contagiousness;
2) an ever-decreasing lethality, to increase their prospects of spreading.
On the other hand, the hosts, through reproduction, and new generations of individuals, more and more evolved and sensitized from the immune point of view, counteract the infection by viruses, which have parasitized the previous generations.
Viruses, intending to increase their chances of contagion, sometimes try to invade new species and, when they succeed, they find themselves a host with different characteristics from those in which they evolved. Consequently, not being in dynamic equilibrium, if they manage to survive in the new host, they often prove to be excessively lethal and very little contagious. Thanks to the extremely rapid mutations of which viruses are capable, they rapidly evolve into more contagious variants, because these are the only ones that can supplant and spread better than the more primitive ones, i.e., the less contagious ones that cannot spread.
At the same time, they evolve mutations that are more and more suitable for the host to survive longer, allowing them to spread longer over time. If more lethal variants were generated, by killing the host, they would spread less than the more primitive ones, as they would be able to infect for a shorter period.
Progressively, the initial virus evolves in the new host species, generation after generation (often in a very short time: days or weeks), with variants that are less and less lethal and more and more contagious. A classic example is the H1A1 influenza virus, which evolved originating from the very lethal ‘Spanish flu’, and today has evolved into a highly contagious pandemic virus, so much so that, throughout one winter season, in Italy in 2015 it infected 11 million individuals, killing only 10,000, among the most fragile and already severely compromised individuals because they are elderly or have multiple pathologies.
1.1 Herd effect
Viruses compete, and so do their hosts. When a virus invades an organism, it sometimes makes it impossible for it to be invaded by other viruses of the same line. The immune systems of the hosts, which fight against new viruses, quickly learn to counteract any new invasion. This is the basis of the vaccination principle: alerting the immune system to defend itself against the spread and multiplication of viruses. This can happen, however, with poorly variable viruses that fail to spread and multiply in vaccinated individuals. In this way, unvaccinated and, consequently, infectious individuals are made increasingly rare and diluted.
In this case, we talk about the herd effect, i.e. making the transmission of the virus more and more improbable: the number of infected people is such that succeeding in infecting the few who are not vaccinated becomes more and more challenging for the virus, until it becomes extinct, as in the case of smallpox.
The herd effect works, however, only with viruses that are not very variable and that, following the vaccine, do not invade the vaccinated individuals. Also, with highly variable viruses, vaccinated individuals do not prevent new variants from invading, spreading, and multiplying, making the herd effect impossible, since each new variant can invade the entire population and not just the unvaccinated.
In this report, it is evident that, based on evolutionary knowledge, so far never refuted by the evolution of viruses and hosts, even the Covid-19 virus has made a species jump recently, invading our species with forms poorly adapted to humans, and, therefore, not very contagious, and very lethal.
However, due to the rapid evolution of these Coronaviruses, in which, given their high variability, host immunization is only partial, the vaccinated, while succumbing less, remain contagious because new variants of the virus multiply and spread.
In fact, like all other viruses, variant after variant (English, Brazilian, South African, Delta, New South African, and recently the Omicron), the Covid-19 is evolving with new variants, which, rapidly, supplant the previous ones, in more contagious forms, and always less lethal, carried both by vaccinated and unvaccinated individuals.
As evidence that this inevitable, and well-known, the evolutionary phenomenon is also occurring in the Covid-19 virus, we present a series of empirical data, all from official sources, such as data from the Istituto Superiore di Sanità, the CTS, and the World Health Organization and International Observatory for the spread of the Covid-19 pandemic.
2. The herd effect can’t work
In the graph below, there is a comparison between the number of vaccinated and infected positive individuals by age group.
Source: ISS
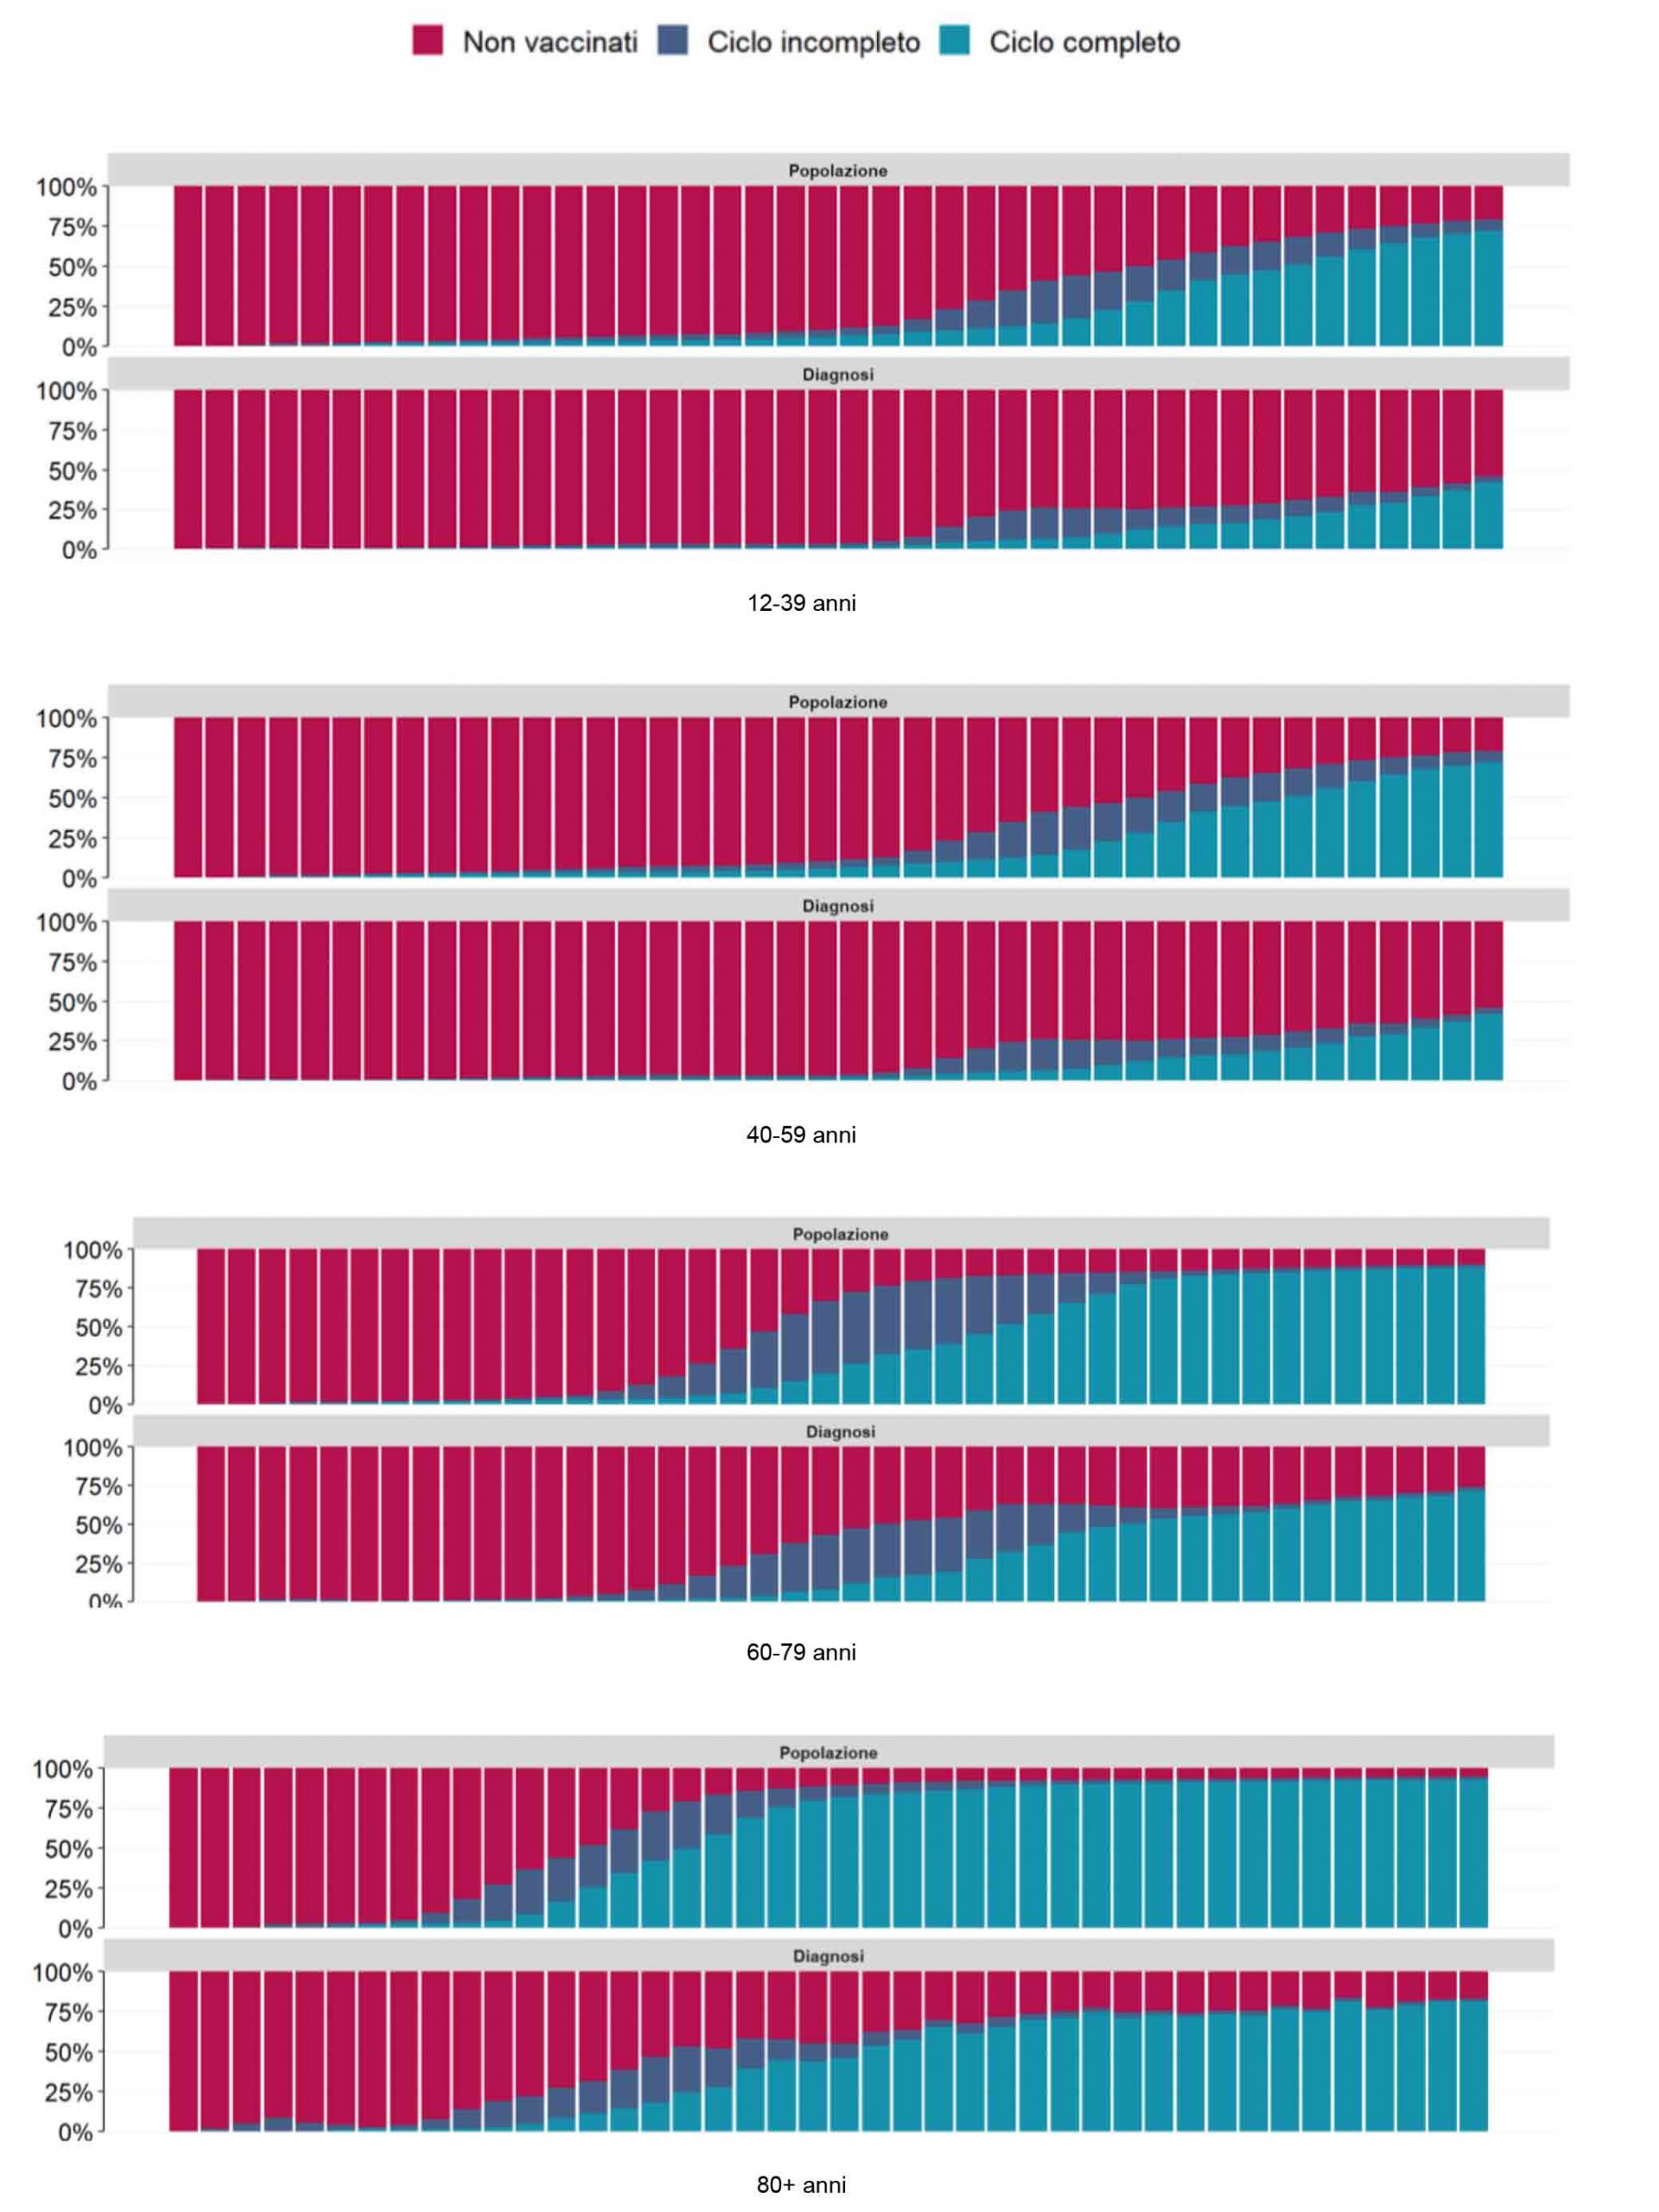
As can be seen from the graphs, as the frequency of the vaccinated increases concerning the unvaccinated, the frequency of the vaccinated infected increases correspondingly. The effect in the older age group, which is, therefore, more at risk, is much greater.
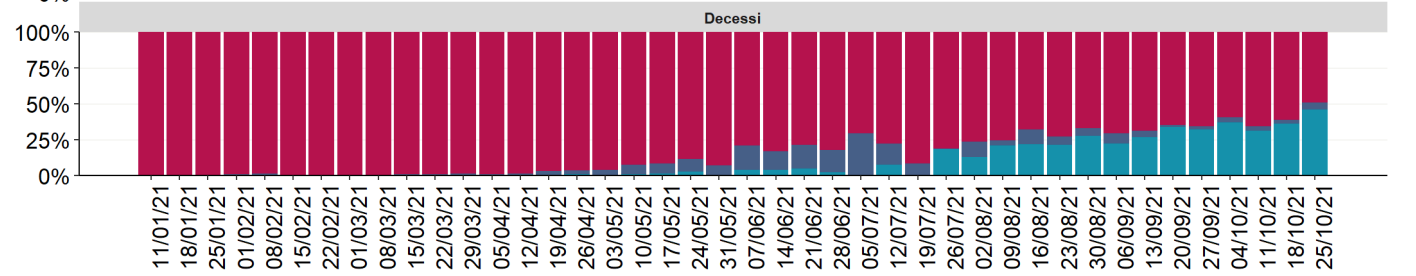
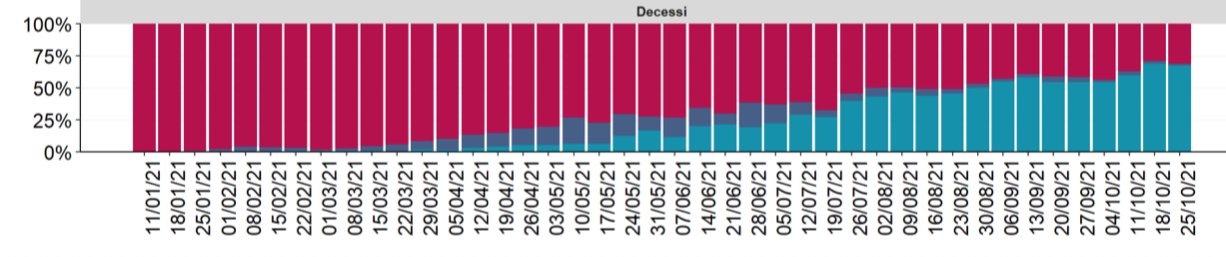
Comparison of the prevalence of fully vaccinated, partially vaccinated, and unvaccinated individuals and the distribution of infections, hospitalizations, intensive care admissions, and deaths, in the over 80+ population.

3. The contagiousness is increasing in wave after wave
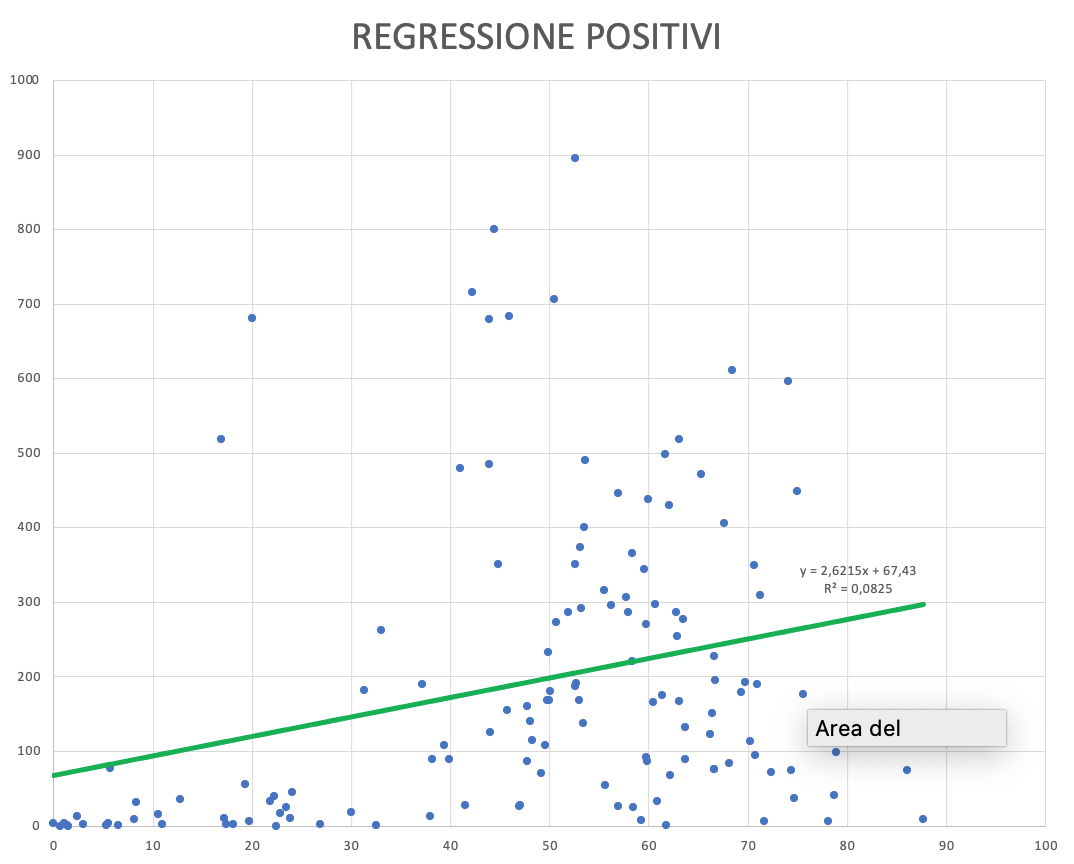
In the above chart, there is proof that the herd effect does not exist: in the abscissas, there is the percentage of vaccination, while in the ordinates there is the number of daily infected per million inhabitants for the most representative world states. The diffusion of the virus increases independently from the number of the vaccinated, demonstrating that the herd effect does not work. The most vaccinated states, instead of having a decrease of the infected (thanks to the presumed herd effect), on the contrary, are the most infected, even if the regression is not significant: surely a herd effect does not exist.
There is, moreover, a second piece of evidence showing that infections are increasing despite the number of vaccinated people in Italy rising from 0% to over 85%.
The data on the sampling of 395,839 teachers scattered throughout Italy, carried out in the months of August – September 2020, revealed only about 22 total positives to molecular swab (the data were extracted from local and national newspapers because the extraordinary commissioner Arcuri has never communicated the official data, despite several requests via PEC, however, have been confirmed by a study conducted by the University of Oxford, to which, apparently, the commissioner, provided the data).
Wanting to approximate by excess, doubling the figure to 40 positives, the total positivity would be equal to 10 infected every 100,000 samples. It is important to remember that, in September 2020, none of the teachers could be vaccinated.
Examining the data on rapid swabs performed in pharmacies and ASLs as of October 15, 2021, on all unvaccinated workers requiring green passes, we have a daily average of 340,357 tests performed and a daily average of 331 positive subjects.
The percentage of positives, then, averaged from October 15, 2021, to November 7, 2021, returns a value of over 100 infected per 100,000 sampled. This last figure suggests that the number of infected people currently positive in Italy is 60,000, while the number of deaths is less than sixty on average, with a mortality rate of 1 per thousand subjects infected.
This comparison is essential because, concerning the swabs performed on the infected, both the teachers in September 2020 and the unvaccinated workers in November 2021, who require green passes to work, are both similar samples, random and independent of bias arising from symptoms, or close relationships with already positive individuals, like all other survey forms that possess, instead, this severe bias to estimate the actual incidence of Covid infections.
Compared to last year, the number of infected in two homologous and independent unbiased samples has increased 10-fold and the number of deaths is extremely low at present.
| Population | Positives | Positive for 100 thousand | |
| Teachers September 2020 | 395.839 | 22 | 6 |
| Workers for green pass October 2021 | 350.357 | 331 | 94 |
All subjects sampled regardless of symptoms and never vaccinated, with similar age-sex class composition (workers)
4. Lethality is decreasing, not just because of the vaccine
To demonstrate that lethality is also decreasing in the uninfected, we show that, independently of the effect of the vaccine, there is a substantial evolution of Covid19, through the succession of new variants, which progressively reduce the impact on host mortality.
We can make three different calculations all leading with different frequencies towards the same mortality reduction effect:
- With the former we compare the first peak mortality, the second peak mortality, and the current mortality, assuming that all deaths are unvaccinated. We then obtain an average of 10.64 deaths per million population in the first peak, 10.48 per million population in the second peak, and 2.8 deaths per million population in a population of about 12 million unvaccinated at the date of writing this analysis.
- Through a second method, we can compare the last week of mortality of the subgroup of unvaccinated in 2021, compared to the same dates in 2020 of the entire population, which at the time, was unvaccinated. In 2020 (in the last week of October) we had about 5.35 deaths per million population, while, in the last week of October 2021, we have about 2,8 deaths per million population in a sample of about 12 million unvaccinated.
3. Finally, with a third method, based on the ISS data, if we start from the data of the same week a year ago, which we recall were 5.35 per million, considering that the recent average of daily deaths (considering the last week of October) is 33 – 35 deaths per day and that the ISS data indicate that the mortality of vaccinated, is about 50% of total mortality from Covid-19 currently (this reasonably considering that, in the range 60-79 years, the relative mortality of vaccinated is about 40% of the total, while that in the age group 80 + is and equal to about 75%: we have, therefore, approximated an average 50% mortality rate for the vaccinated population).
Then it is derived that half of the current deaths attributable to the sample of unvaccinated is halved, with a value of about 11 – 12 per day, coming, therefore, to about 4 deaths per million unvaccinated inhabitants, which remember are about 12 million.
It is clear and indisputable that vaccinated deaths are about 0.4 deaths per million inhabitants, considering that the vaccinated are about 48 million, then with a mortality rate much lower than unvaccinated.
However, the mortality of the unvaccinated in one year decreased from 5.35 to 1.4, with no contribution from the vaccine!
Through all three independent methods, it is clear that the new Covid-19 variants have drastically reduced mortality compared to the original variant. In other words, the virus has evolved and will evolve further towards a drastic reduction in mortality, as happened exactly in 1919 with the Spanish flu, without treatment or vaccines.

5. Worldwide mortality and infection
Considering the data published by the international observatory on Covid-19, among almost all countries in the world (some are too small and others do not provide data to the observatory), they clearly show that, worldwide, there is no correlation between the frequency of how many were vaccinated and how many died in that given country.

It can be seen that, to date, there is no significant negative relationship between the number of vaccinated persons and mortality: on the contrary, it is often positive. This scenario occurs all over the world except in the United States and Europe, where there is also a higher incidence of mortality and contagion than in the rest of the world. The above two continents are also those with the highest number of elderly people in the world. In the others, even, the more the number of vaccinated people increases, the more the contagions increase.
6. The course of Spanish influenza in the USA
Source
The studies reached another important conclusion: That relaxing intervention measures too early could cause an otherwise stabilized city to relapse. St. Louis, for example, was so emboldened by its low death rate that the city lifted restrictions on public gatherings less than two months after the outbreak began. A rash of new cases soon followed. Of the cities that kept interventions in place, none experienced a second wave of high death rates. (See photos that capture a world paused by Coronavirus)
In 1918 studies found that the key to flattening the curve of infections and deaths was social distancing. This strategy remains valid for Covid-19 as well. There is an immense treasure trove of very useful historical information that, only now, has begun to be exploited to improve our strategies.
Epidemiologist Stephen S. Morse of Columbia University says: “The lesson of 1918, if properly understood, could help us not to repeat the same history today”, but it seems that unfortunately he has gone unheeded.
Source: National Geographic
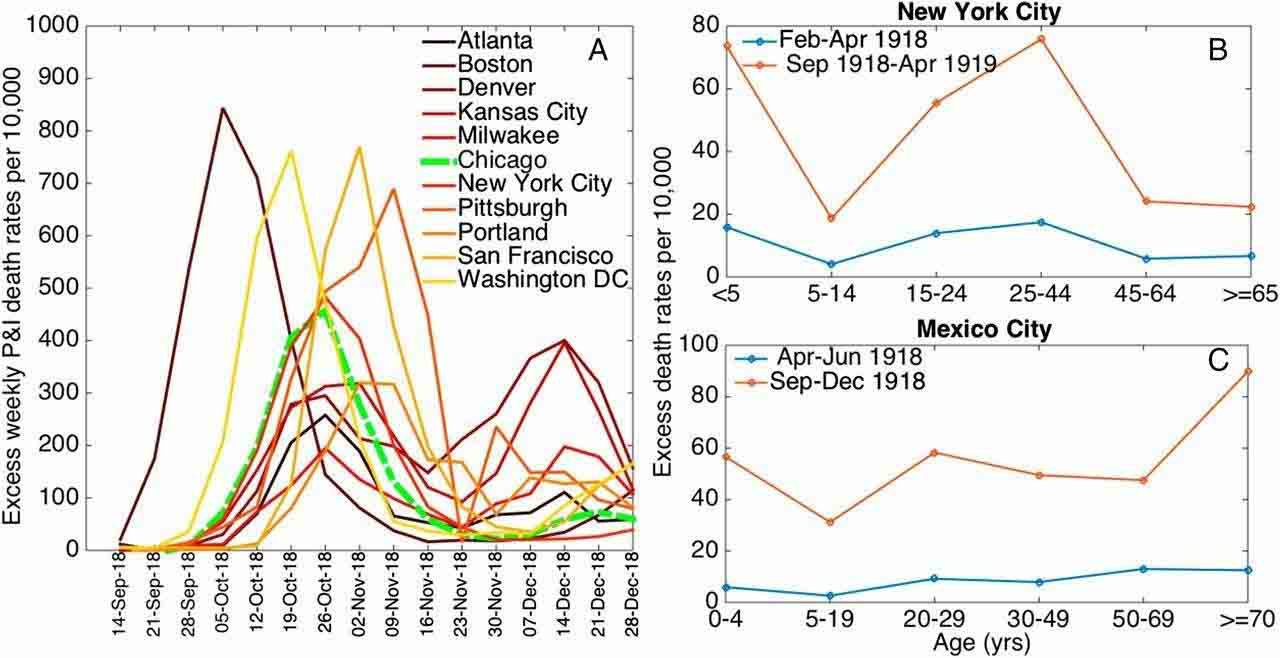
In any case, although the Spanish flu was very lethal, the distancing strategies of the first phase influenced, in a decisive way, the second wave. Regardless of the relaxation of distancing strategies, there were no third waves, even without vaccines and special treatments (there was not even penicillin, discovered in 1928).
7. Excess mortality compared to the expected: the case of Italy

In this graph, we observe the average number of deaths, year by year in Italy, compared with the expected frequency of mortality concerning previous years.
First, it is noted that there are spikes in excess mortality each year at seasonal influenza outbreaks that occur in winter.
Apart from 2017, where a relatively exceptional spike is observed, it is appreciated that in the first two waves before and after summer 2020, with extremely high mortality spikes, thereafter no mortality spike in excess of expected is evident: it means, in practice, that the virus has subsided into the norm of lesser seasonal influences.
There is currently no excess mortality. Against a sample of 12 million unvaccinated, excess mortality should probably result.
8. Coronavirus influenza has not yet reached its dynamic equilibrium in humans
The 2009 influenza pandemic mainly affected children and young adults, and the impact of the 2009 H1N1 pdm09 pandemic, for example, during the first year was less severe than previous outbreaks.
However, it is estimated that mortality from the H3N2 pandemic affected 0.03% of the population in 1968, while the Spanish H1N1 mowed down 1% to 3% of the world’s population, in 1918-1920.
It is estimated, however, that 0.001% to 0.007% of the world’s population died from pulmonary complications associated with H1N1 pdm09 during the 2009 pandemic.
It wasn’t until August 2010 that the WHO declared the H1N1 pandemic influenza ended, however, the virus continues to circulate as the seasonal flu, much attenuated, although it has caused illness, hospitalizations, and deaths worldwide every year since. (Source: The 2009 H1N1Pandemic: Summary Highlights, April 2009 – April 2010).
In 2015, seasonal influenza, in about 4 months, infected 11% of the Italian population. Covid-19, in two years, infected less than 8% of the population.
Seasonal flu came to kill, in 2015, about 8000 people over 4 months. Also 2017-2018, in Italy, was a very bad year of excess mortality from influenza, in the general population. In that season the types B, and A of the strains A/H1N1pdm09 were dominant in the virus. Among severe and severe cases, especially among deaths, more than half of the cases were caused by the A/H1N1pdm09 virus. During the seventeenth week of 2018, for example, mortality occurred with a daily average of 184 deaths, this from seasonal influenza in 2018.
Covid-19 currently (end of October 2021) has subsided and is killing about 30-40 people a day: less than the 2018 flu peak, and with an annual mortality expectation (if, against our predictions, it doesn’t de-grow again and mortality remains constant) at an annual total of 15,000 deaths, approximately.
Coronavirus is more lethal than influenza, since, in 15 months, (between the first and second wave) it killed about 100,000 people. There is no doubt that the mortality of Covid-19 has been mitigated by vaccines, which have also partially mitigated the seasonal flu, year after year.
Seasonal flu is highly contagious and relatively non-lethal. Coronavirus is relatively low in contagiousness, but contagiousness is gradually increasing. Lethality in the unvaccinated has increased from 100,000 deaths in 12 months (late February 2020 – early March 2021) to a potential number of about 10,000 deaths (10 times less) in the next 12 months.
If everyone were unvaccinated, and assuming, as a last resort, that all deaths are currently unvaccinated, it would be around 30,000 deaths in the next 12 months (30-35 deaths for day, for 365 days, at present value).
Therefore, it can be concluded, numbers in hand, that the mortality rate of Coronavirus has been attenuated even without vaccines, and that the data of contagiousness, compared to the more classic seasonal flu, are not sufficient to consider it a pandemic. Exactly as predicted by the theory of evolution applied to Covid-19 as to all other viruses endemic in humans.
Coronavirus is more lethal than influenza, since, in 15 months, (between the first and second wave) it killed about 100,000 people. There is no doubt that the mortality of Covid-19 has been mitigated by vaccines, which have also partially mitigated the seasonal flu, year after year.
9. Causes of mortality in Italy: smoking, Coronavirus, and the Hippocratic Oath
Smoking infects and kills others. Tobacco use is responsible for 25% of all cancer deaths globally. Nicotine and tobacco products increase the risk of cardiovascular and lung disease. More than one million people die each year from exposure to second-hand smoke alone (20.6% of all deaths among men and 7.9% of all deaths among women) with direct and indirect costs of more than €26 billion.
It is estimated that more than 93,000 deaths per year in our country are attributable to tobacco smoke: (254 deaths per day of causes attributable to smoking, and only 30 attributable to Covid19 currently) more than 25% of these deaths are between 35 and 65 years of age. About cancer, tobacco is the risk factor with the greatest impact, accounting for at least 43,000 deaths per year.
As far as lung cancer is concerned, one of the main smoking-related pathologies in our country, mortality and incidence are decreasing among men but increasing among women, for whom this pathology has overtaken stomach cancer, becoming the third cause of death from neoplasia, after breast and colorectal cancer. With lung cancer, the last days of life are spent in intensive care with assisted breathing.
In Italy, it is estimated that more than 93,000 deaths can be attributed to tobacco smoke. As far as tumors are concerned, tobacco is the risk factor with the greatest impact to which at least 43,000 deaths per year can be attributed.

It is, therefore, necessary to continue to invest in effective strategies to combat smoking, including health promotion actions, cessation support, and policies to reduce demand and supply (extension of spaces where smoking is not allowed, regulation of advertising, tax and price policies), but never has a suspension from work, and from pay, been hypothesized, as has been done in the case of those who do not vaccinate against Covid-19, which is likely to produce fewer than 15 deaths per day (total number of unvaccinated deaths per day at present).
So, what is the scientific or health reason for considering the unvaccinated to be responsible for intensive care occupancy, when smoking cases alone do so 15-16 times more?
We have demonstrated, with empirical and official evidence and in a more than obvious way, that the lethality of Covid-19 has dramatically decreased even in unvaccinated people, regardless of vaccine adoption. In contrast, the lethality of smoking remains constant over the years, yet no politician or journalist has ever come out and said that smoking patients take up beds that could be reserved for other patients. Yet, direct death from smoking is the consequence of deliberate and vicious behaviour.
How could medicine have forgotten the Hippocratic oath?
How can doctors, or those who still profess to be such, claim that unvaccinated Covid-19 patients should be excluded from treatment, as certain virologists of dubious reputation do on television?
Have we already forgotten the teachings of the recently deceased Gino Strada of Emergency, who always forcefully affirmed that winners and losers should be treated with equal rights?
Even in war, the Geneva Convention obliges medical assistance to enemy prisoners. Finally, as historian Alessandro Barbero says: “We admire the major democracies that recognize and accept the right of conscientious objection, even if this increases the risk of mortality of those who, forced into conflicts, use weapons”.
10. Conclusion
The herd effect, we have shown clearly, does not exist for Covid-19, nor can it ever be achieved.
The people who infect are both vaccinated and the unvaccinated, in equal measure. They infect both old and young people and children, all in equal measure: it is useless to discriminate against anyone for an alleged greater ability to spread the infection than others.
No one is a particular anointed by anyone else, and, therefore, should not be persecuted or forcibly induced to change their opinion.
All the empirical pieces of evidence reported here clearly show that the virus, variant after variant, is evolving towards increasing contagiousness, and always towards a greater sublethality, as here widely demonstrated, until it will reach a dynamic equilibrium, between virus and host, as it has already happened for all the endemic viruses in our species.
Only for the Coronavirus, and the increasingly reduced fraction of intensive care units and beds occupied by the unvaccinated, restrictive measures have been taken never imagined before, nor in the flu epidemics that claim more victims per day, nor for hospitalizations from smoking and smoking, which clog much more intensive care units than the patients of Covid-19, even if unvaccinated.
As is being done with the green pass, and with the restrictions on liberty consequent upon its adoption, how can one wish for the right not to assist those who do not vaccinate?
We have therefore arrived at the irrationality and loss of ethics if, for any cause right or wrong that is, it is argued that it is right to discriminate against the few patients without vaccine ended up in the hospital, from all others, including smokers, alcoholics, mobsters, criminals and various robbers, who, incidentally, still clog the intensive care, without any media resonance.
Addendum
As of the 17th of December. https://nymag.com/intelligencer/2021/12/how-mild-is-omicron-really.html, new estimates on the new Omicron variant show that omicron seems threefold more contagious, ant thirty times less lethal, exactly as predicted by this study made when still unaware of the new variant data
General bibliography
Alcock, J. Animal Behavior: An Evolutionary Approach, Sinauer 2013, ISBN-10: 0878939660
Bell, G. (1982). The Masterpiece Of Nature: The Evolution and Genetics of Sexuality. University of California Press, Berkeley, 378 pp.Hautmann, Michael (2020). “What is macroevolution?”. Palaeontology. 63 (1): 1–11.
doi:10.1111/pala.12465. ISSN 0031-0239.
Burt, A. & Trivers, R. L. (2006) Genes in Conflict : The Biology of Selfish Genetic Elements. Belknap Press, Harvard. ISBN 0-674-01713-7
Clarke, David K., et al. “The red queen reigns in the kingdom of RNA viruses.” Proceedings of the National Academy of Sciences 91.11 (1994): 4821-4824.
Cooper, T. F.; Lenski, R. E.; Elena, S. F. (2005). “Parasites and mutational load: An experimental test of a pluralistic theory for the evolution of sex”. Proceedings of the Royal Society B: Biological Sciences. Royal Society. 272(1560): 311–317. doi:10.1098/rspb.2004.2975.
Dawkins, Richard. The Selfish Gene:30th Anniversary Edition. Oxford University Press, 2006, p. 250.
Jokela, Jukka; Dybdahl, Mark; Lively, Curtis (2009). “The Maintenance of Sex, Clonal Dynamics, and Host-Parasite Coevolution in a Mixed Population of Sexual and Asexual Snails”. The American Naturalist. 174 (s1): S43–S53.
Hamilton, W. D.; Axelrod, R.; Tanese, R. (1990). “Sexual reproduction as an adaptation to resist parasites”. Proceedings of the National Academy of Sciences of the USA. 87 (9): 3566–3573. doi:10.1073/pnas.87.9.3566.
Hamilton, W. D. (1980). “Sex versus non-sex versus parasite”. Oikos. 35 (2): 282–290. doi:10.2307/3544435. JSTOR 3544435.
Lotka, A.J., “Analytical Note on Certain Rhythmic Relations in Organic Systems” Proc. Natl. Acad. Sci. U.S., 6, 410–415, (1920).
Lotka–Volterra Predator-Prey Model (http://www.egwald.ca/nonlineardynamics/twodimensionaldynamics. php#predatorpreymodel) by Elmer G. Wiens.
Morran, Levi T.; Schmidt, Olivia G.; Gelarden, Ian A., II; Parrish, Raymond C.; Lively, Curtis M. (2011). “Running with the Red Queen: Host-Parasite Coevolution Selects for Biparental Sex”. Science. 333 (6039): 216–218. Bibcode:2011Sci…333..216M.
Rabajante, J; et al. (2016). “Host-parasite Red Queen dynamics with phase-locked rare genotypes”. Science Advances. 2 (3): e1501548. Bibcode:2016SciA….2E1548R. doi:10.1126/sciadv.1501548. ISSN 2375-2548. PMC 4783124. PMID 26973878.
Trivers, R. L. (1985) Social Evolution. Benjamin/Cummings, Menlo Park, CA.
Trivers, R. L. (2002) Natural Selection and Social Theory: Selected Papers of Robert L. Trivers. (Evolution and Cognition Series) Oxford University Press, Oxford. ISBN 0-19-513062-6
Van Valen, Leigh (1973). “A new evolutionary law” (PDF). Evolutionary Theory. 1: 1–30.
Volterra, V., Variations and fluctuations of the number of individuals in animal species living together in Animal Ecology, Chapman, R.N. (ed), McGraw–Hill, (1931)
Web Pages
https://tobaccoatlas.org/wp-content/uploads/2018/03/TobaccoAtlas_6thEdition_LoRes_Rev0318.pdf
https://www.epicentro.iss.it/influenza/2015h
https://asm.org/Podcasts/TWiV/Episodes/TWiV-Special-SARS-CoV-2-epidemiology-with-Stephen
The 2009 H1N1 Pandemic: Summary Highlights, April 2009-April 2010
https://nymag.com/intelligencer/2021/12/how-mild-is-omicron-really.html


